The NIFTY 50 can tell you where the index is going. It cannot tell you where every stock is going. A look at four years of stock-level data reveals why investors and traders should look beyond the headline index number.
When the NIFTY 50 falls sharply, the natural reaction is to assume that the broader stock market is falling with it. When the index rises, we tend to assume that most stocks are participating in the rally. But is that actually what happens? An analysis of NSE-listed stocks with decent trading volume suggests that the relationship between the index and individual stock performance is far more complicated.
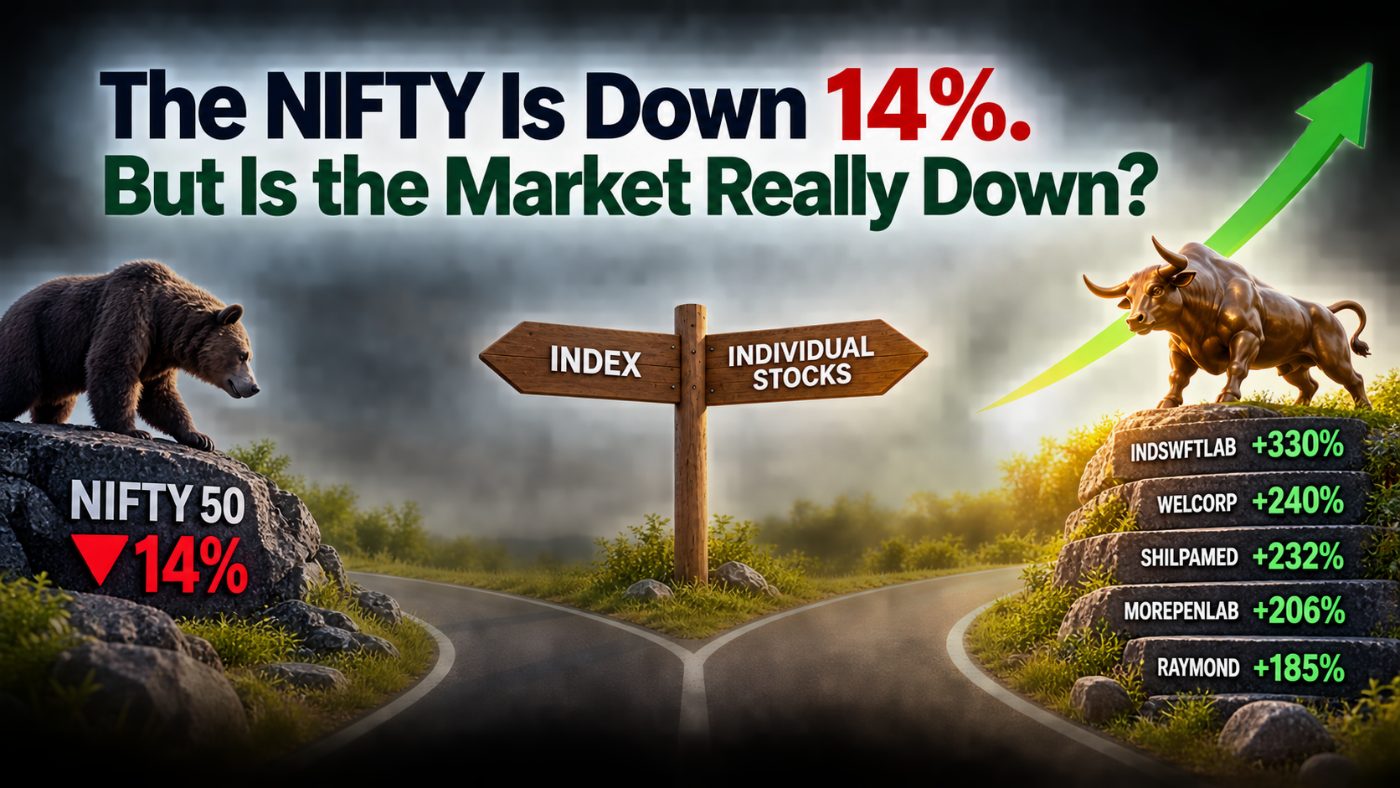
Between 1 January and 30 September 2026, the NIFTY 50 declined around 14%. On the surface, that looks like a difficult market. And there is no denying that the broader market faced significant pressure during the period. September alone saw the NIFTY 50 fall more than 6%, with foreign investor outflows, higher oil prices, rising global yields and geopolitical concerns adding to market pressure. But looking at individual stocks reveals a very different story.
During the same January to September 2026 period, around 33% of the stocks in the analysis gained more than 10%. The average gain among these stocks was an impressive 45%. At the other end, 39% of stocks declined by more than 10%, recording an average loss of around 24%. The remaining 28% stayed broadly range-bound, with an average loss of only around 1%.
In other words, while the NIFTY 50 was down sharply, one out of every three stocks in the analysis had gained more than 10%. The market was not moving uniformly in one direction. It was creating a wide divergence between winners and losers.
The individual stock numbers make this divergence even more striking. Ind Swift Laboratories gained around 330%, Welspun Corp around 240%, Shilpa Medicare around 232%, Morepen Laboratories around 206%, and Raymond around 185% during the period covered. These were not small variations around the index. They were transformational moves.
At the same time, the other side of the market was equally extreme. India Glycols declined around 70%, KPIT Technologies around 57%, Alok Industries around 56%, Bharat Rasayan around 55%, and UGRO Capital around 54%. The same market that produced stocks capable of more than doubling also produced stocks that lost more than half their value.
This is the part of the market that an index number can easily hide.
Now compare the situation with the same January to September period in 2025. The NIFTY 50 was up around 4%, giving the impression of a relatively positive market. But among the individual stocks analysed, only 22% gained more than 10%, while as many as 50% declined by more than 10%. The average gain among the winners was around 33%, while the average loss among the declining stocks was around 25%. Another 28% remained broadly range-bound, with an average loss of around 1%.
So here is the interesting observation: a rising NIFTY does not necessarily mean that most stocks are rising, and a falling NIFTY does not necessarily mean that opportunities have disappeared.
This raises an important question for every market participant: when the NIFTY is falling, should we simply conclude that the market is bad, or should we ask whether we were able to identify the stocks that were still showing strength?
There is another uncomfortable question worth asking.
Did we continue holding a stock because it had been a multibagger in the past? Did we buy something because its historical returns looked attractive, even though its current trend had changed? Did we wait too long for a recovery because accepting a small loss felt difficult? Did we identify stocks showing fresh momentum, or did we keep looking backward?
And perhaps the most fundamental question is whether we are clear about what we are trying to do in the market.
Are we investors? Are we traders? Are we trying to combine both approaches without clearly defining the rules for either?
There is nothing inherently wrong with being a long-term investor or a trader. The problem begins when the behaviour does not match the strategy. A long-term investor may be willing to tolerate substantial short-term volatility when the underlying investment thesis remains intact. A momentum-oriented trader operates differently. The entry, trend, position size, risk and exit process can matter far more than what the stock did several years ago.
This is why market volatility should not automatically be treated as a problem.
Market swings are the nature of the market.
We cannot control whether the NIFTY rises or falls. We cannot know with certainty which stock will become the next multibagger. We cannot eliminate losing trades. What we can control is the process we use to identify opportunities, size positions and respond when our view turns out to be wrong.
A disciplined process also changes the way we think about losses. A loss does not necessarily mean that the process failed. If the position was taken according to predefined rules and the position was exited when those rules indicated that the idea was no longer working, the loss may simply be part of the process.
The objective is therefore not to be right about every stock.
It is to build a process that can participate in strong opportunities while controlling the damage when the opportunity does not work. The NIFTY 50 will continue to rise and fall. Some stocks will outperform dramatically. Others will lose substantial value. Many will simply move sideways.
The important question for an investor or trader is not only "Where is the index going?"
It is also:
"Where is the strength, where is the weakness, and does my process allow me to identify the difference?"
Because a falling index does not necessarily mean that opportunity has disappeared.
Sometimes, the opportunity has simply moved somewhere else.

Why We Want High Returns but Fear Risk: The Indian Investor Paradox
India's investors want high returns but remain deeply afraid of taking risks—a fascinating paradox highlighted by the SEBI Investor Survey 2025. As access to investment products and information grows, the real challenge is shifting from more choices to better guidance, trust and informed financial d

21 Crore Demat Accounts — But How Many Indians Are Actually Investing?
India has crossed 21 crore demat accounts. Sounds like a massive investing revolution. But SEBI's data reveals a more nuanced story: accounts are growing much faster than active, sustained participation. So, are Indians really becoming long-term investors—or are we simply opening more accounts?

Lumpsum vs. SIP vs. Direct Equity: Which Wealth Creation Route Is Right for You?
Compare lumpsum investments, SIPs, and direct equity stocks. Learn the risks, rewards, and time commitments of each strategy to choose the right path for your financial goals.
Comments
Loading…