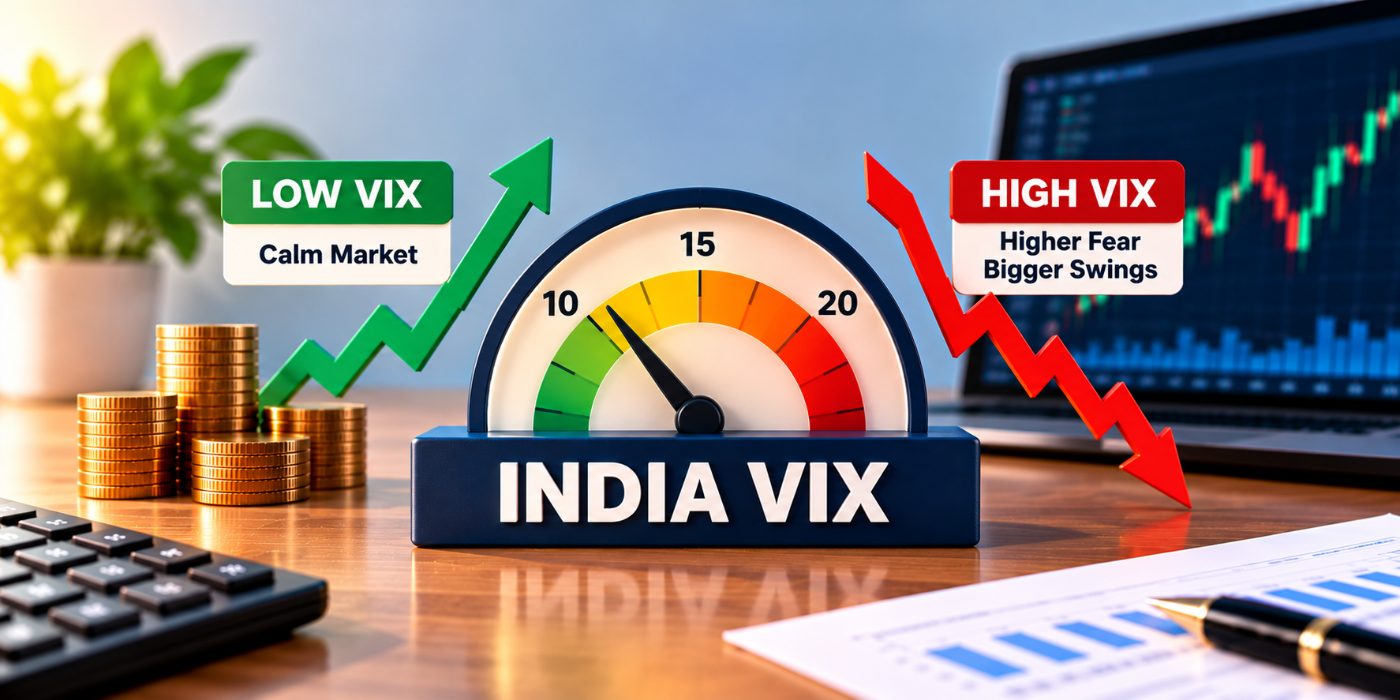
On calm days you never hear about it. On scary days it's everywhere: "India VIX jumped 15%." The VIX is the market's fear gauge — and knowing how to read it, and where the number actually comes from, tells you how nervous investors really are. This is for learning only.
What India VIX measures
India VIX measures the volatility the market expects over the next 30 days, calculated from the prices investors are paying for Nifty options. When people pay up for options to protect themselves, it signals they expect big moves — and VIX rises. In short, it's a thermometer for expected turbulence, not a prediction of direction. It is published by the NSE and quoted as an annualised percentage.
How India VIX is calculated
This is where most explanations stop short. India VIX is not taken from a single option or a simple formula — it is built from the live prices of a whole range of Nifty option contracts. In plain words, here is what goes into it:
- It reads Nifty index options, not stocks. It uses the out-of-the-money call and put options on the Nifty — the strikes above and below the current index level — because those are what investors buy to bet on, or hedge against, big moves.
- It uses two expiries. It takes the near-month and next-month option series and blends them, so the result always reflects a constant 30-day horizon.
- It uses the best bid and ask. For each option it takes the midpoint of the best buy and sell quotes in the order book — the real, live price traders are willing to pay.
- It adds them all up, cleverly weighted. The formula (adapted by NSE from the global CBOE VIX method) sums the prices of all these options, giving more weight to strikes nearer the money and adjusting for the gap between strikes and for the risk-free interest rate. The richer those option prices are across the board, the higher the implied volatility.
- It annualises the result. That combined figure is converted into a standard deviation of expected returns, expressed as an annual percentage. That's the number you see.
The intuition: VIX doesn't guess volatility directly — it reverse-engineers it from what the whole options market is willing to pay for protection. Expensive options across many strikes mean traders expect large swings, so VIX is high; cheap options mean calm is expected, so VIX is low.
Turning the number into a real-world move
Because VIX is an annualised figure, you can translate it into an expected monthly move. Divide by the square root of 12 (about 3.46):
- A VIX of 15 implies roughly a ±4.3% move in the Nifty over the next month (one standard deviation).
- A VIX of 30 implies roughly ±8.7% — nearly double the expected swing.
So VIX isn't an abstract index; it's the market's own estimate of how wide the next month's range is likely to be.
Reading the levels
| India VIX | What it usually signals |
|---|---|
| Roughly 10–15 | Calm, even complacent markets |
| 15–20 | Normal to mildly cautious |
| Above ~20–25 | Rising fear and bigger daily swings |
| Above 30 | Serious stress |
In the worst panics it goes far higher — India VIX spiked above 80 during the 2008 global crisis and again in the March 2020 COVID crash.
The key quirk: it moves opposite to the market
VIX almost always rises when the market falls and falls when the market is calm and climbing. That inverse relationship is why a sudden VIX spike is a shorthand for "fear just entered the room." It happens because investors rush to buy protective options when prices drop, pushing option prices — and therefore the calculated VIX — up.
How to use it
VIX is not a buy or sell signal on its own. It's context: high VIX means wider swings, so disciplined investors may size positions smaller and expect a bumpier ride; very low VIX can hint at complacency. It's a gauge to respect, not a trigger to act on.
Volatility is the weather, not the destination. A rule-based approach with risk defined in advance — the idea behind our Model Portfolio — is built to keep working through calm and storm alike. For what actually drives the swings, see what moves the market.
What happens when a stock is delisted — and what it means for your money
A company leaves the exchange and your shares stop trading. Delisting explained: voluntary vs forced, what you're owed, and the risk of being left stuck.
Promoter pledging: the red flag hiding in plain sight
When a company's owners pledge their own shares for loans, trouble can follow. What promoter pledging is, why high pledging is dangerous, and where to check it.

How a stock's price is actually set
Nobody "fixes" a share price — it's decided every second by buyers and sellers. How the order book really works, in plain words.
Comments
Loading…